Confluence
In trading, the presence of confluence refers to a circumstance where multiple technical analysis factors collectively form the same indication. Since multiple factors are combined, confluence has the potential to greatly increase the reliability and accuracy of trades. Arguably confluence is the most important probability enhancer in trading.
Popular examples of confluence are:
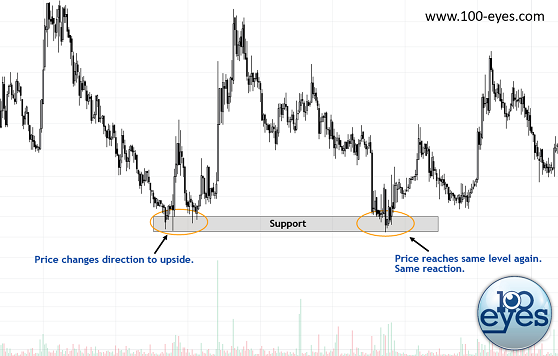
- a point where a broken resistance (now acting as support) aligns with a support trend line.
- a point where a support level meets a Fibonacci retracement level
- a point where a dynamic form of support (e.g. MA support) aligns with a static support (e.g. a horizontal level)
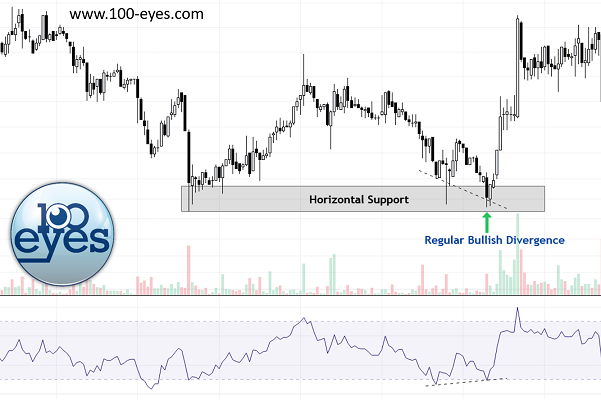
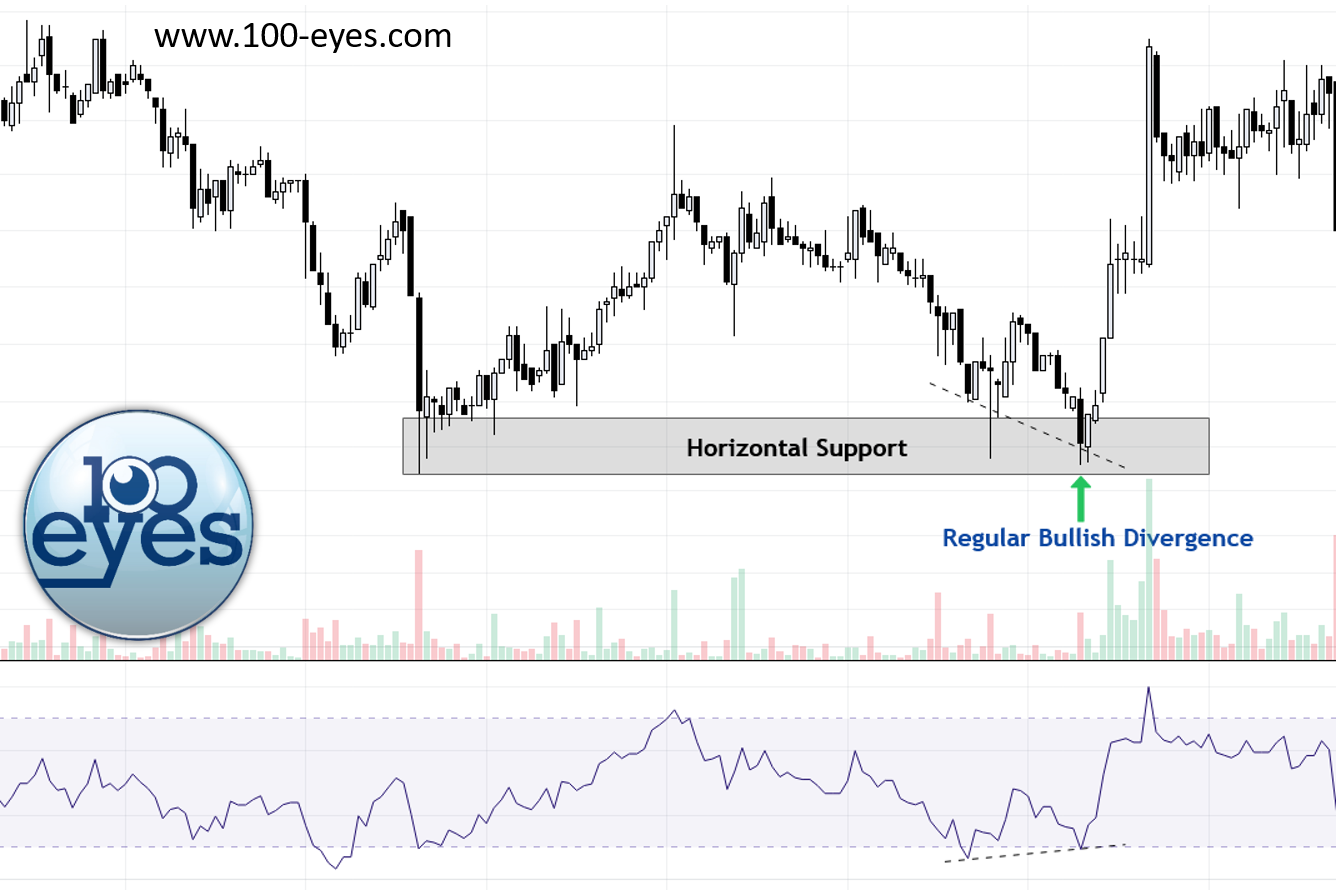
- a point where an oscillator (like RSI) gives a strong signal at a level which also acts like support (e.g. a bullish divergence at a horizontal support level)
The chart below shows an example of perfect confluence. The bullish divergence on the RSI perfectly aligns with a horizontal support zone, providing a very high probability trading setup.
Avoid combinations of correlated factors
When applying the concept of confluence, strongly correlated factors cannot be combined (e.g. indicators that measure something similar). RSI, MFI, Stochastics, and Stoch RSI, cannot be combined to establish confluence since they are all oscillators. An oscillator could be combined with other technical analysis factors (e.g. horizontal support), but combining a bunch of oscillators or other strongly correlated factors will not enhance reliability nor profitability.
About 100eyes
Stop spending hours of your time searching for good entries. Make your crypto or forex trading easier by using the 100eyes scanner.


Tags
market updates crypto binance discount referral confluence RSI Divergence Divergence MACD divergence support and resistance horizontal support horizontal resistance risk management risk risk reward okex trading fees market_updates