What are divergences
A divergence occurs when an oscillator’s local tops/bottoms do not match local tops/bottoms of price. Divergences are considered powerful and reliable entry triggers, both for reversals and continuations.
Divergences are particularly popular due to their predictive and leading (not lagging) nature.
Although divergences can be applied to many momentum oscillators, the RSI (Relative Strength Index) is typically the oscillator of choice.

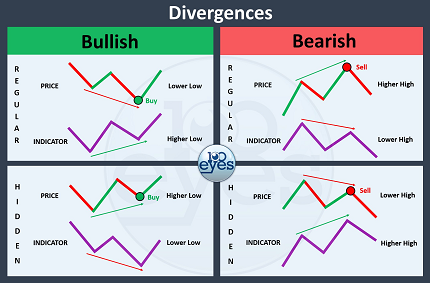
The cheat sheet above shows the four most important types of divergences:
What is the difference between Regular and Hidden Divergences
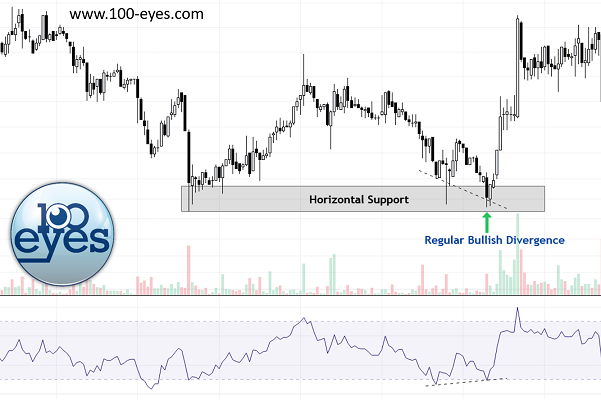
Regular divergences are reversal signals. When a regular divergence occurs, it indicates that the trend is strong but its momentum has weakened. It provides an early warning that a trend reversal (or at least a pull back) is likely to follow soon.
Regular divergences can be powerful and reliable entry triggers. In fact, as far as oscillators go (and technical indicators in general), regular divergences are considered the most reliable early signs of a local bottom or top.
Especially when confluence is present, regular divergences can provide “high probability” trading setups. Therefore, strategies involving divergences tend to be relatively forgiving when traded using a low Risk Reward Ratio.
Hidden divergences are continuation signals. They are most likely to occur in the middle of a trend and often indicate the end of a pullback within the existing trend.
After a hidden divergence, a trend often continues. They can be powerful and reliable entry triggers, especially when some kind of confluence is present. Hidden divergences are typically used to “hop on” a trend after a healthy pull back just occurred.
What is the perfect length for a divergence? | Understanding momentum
In trading the term momentum refers to “short-term strength in either direction”. In contrast to trend – which refers to a general direction over a longer period of time – momentum has a short-term nature.
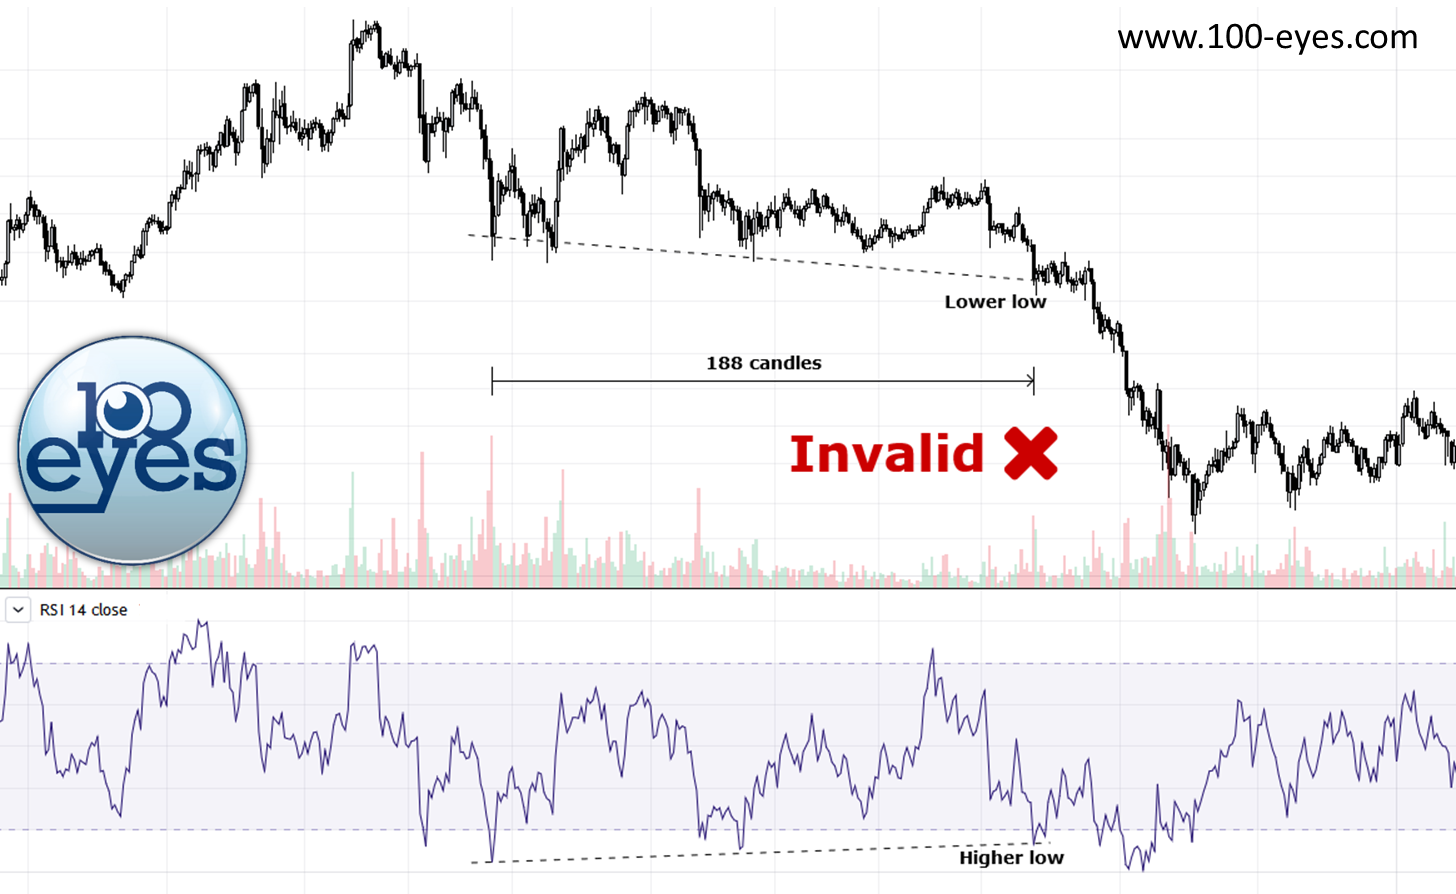
The RSI (Relative Strength Index) is a momentum oscillator. Since its calculation is based on short-term price action, its application should be too. By default the RSI only takes into account 14 candles. Given RSI’s short-term nature, divergences are not valid when applied to a large amount of candles.
The term momentum and its usage are often misunderstood, resulting in traders drawing two lines across 100+ candles and calling it a divergence. These divergences are theoretically and by definition invalid and dangerously unreliable.
In regards to the RSI and other common oscillators, the current situation on the chart is completely unrelated to the situation 100+ candles ago. Price cannot be expected to rise after a lower low “because 100+ candles ago the RSI value was a little bit lower than the current RSI value”.
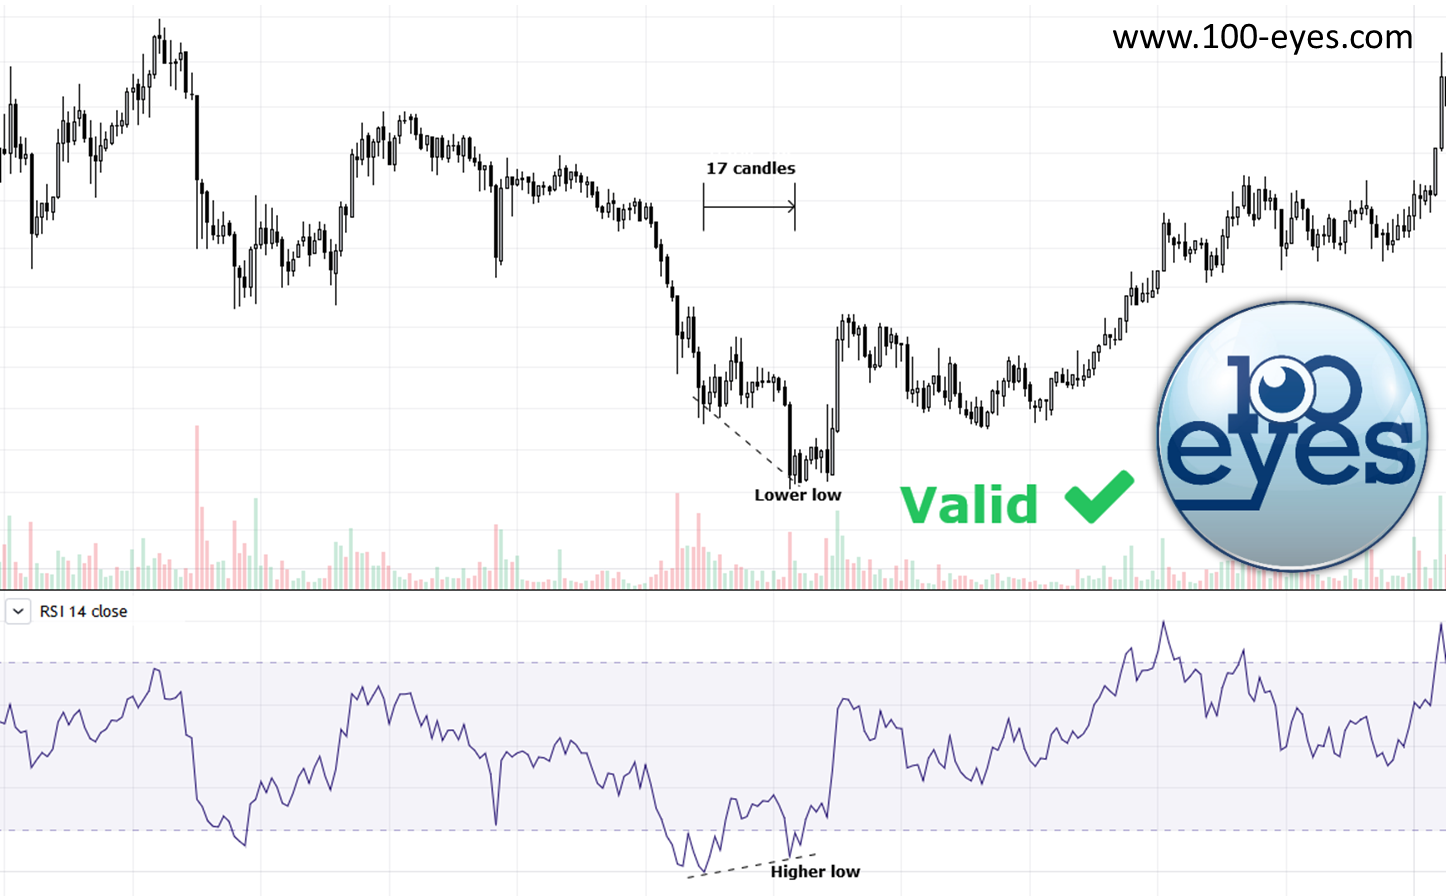
Between valid and invalid there is a debatable gray area. Divergences have the most predictive value if they occur within a range of 15-25 candles. As a rule of thumb, divergences are usually invalid and lose all predictive value when applied to 40 candles or more. The charts below show an example of a valid and invalid regular bullish divergence.
Divergence Alerts
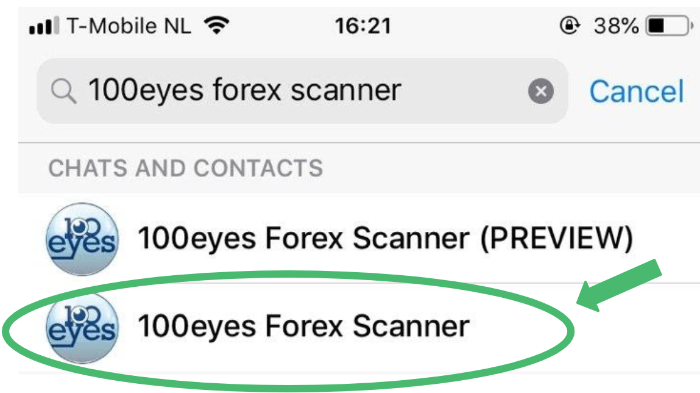
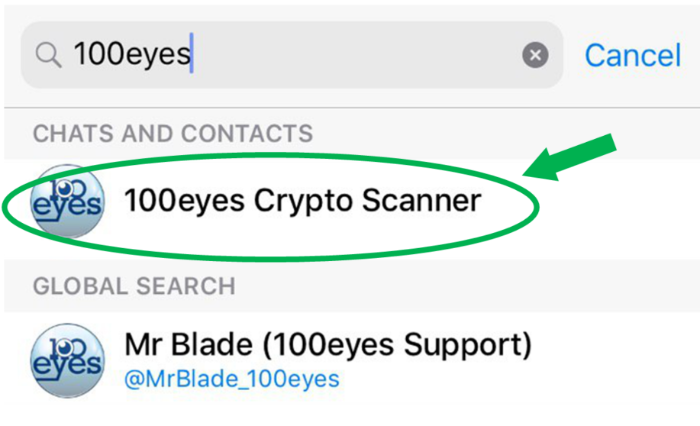
Automated alerts for divergences are available in the 100eyes scanner. If you are looking for a divergence indicator for crypto you can use the 100eyes Crypto Scanner, and if you are looking for a divergence scanner for Forex currency pairs or commodities (such as Gold and Silver) you can use the 100eyes Forex Scanner.
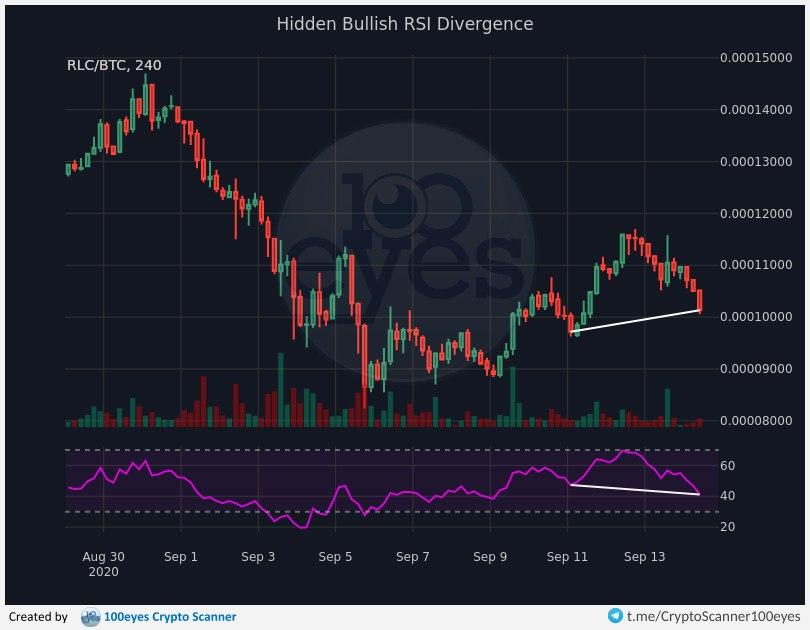
The 100eyes scanner provides automated alerts for many different kinds of divergences. Each alert comes with an automatically generated image which shows where the divergence is taking place. This makes it very easy for beginning traders to understand what is going on, and more time-efficient for advanced traders.
Our divergence alerts are especially useful since Tradingview does not provide a reliable Divergence indicator, so without 100eyes it can be difficult to spot RSI divergences quickly or get alerted when a new RSI divergence is found.
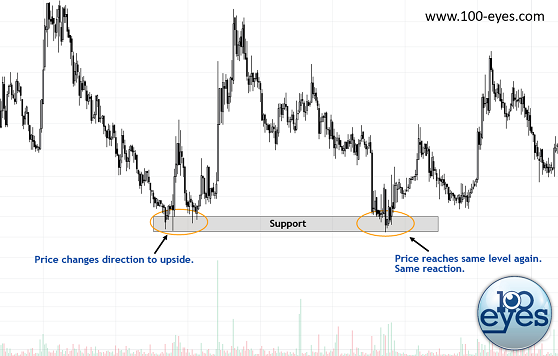
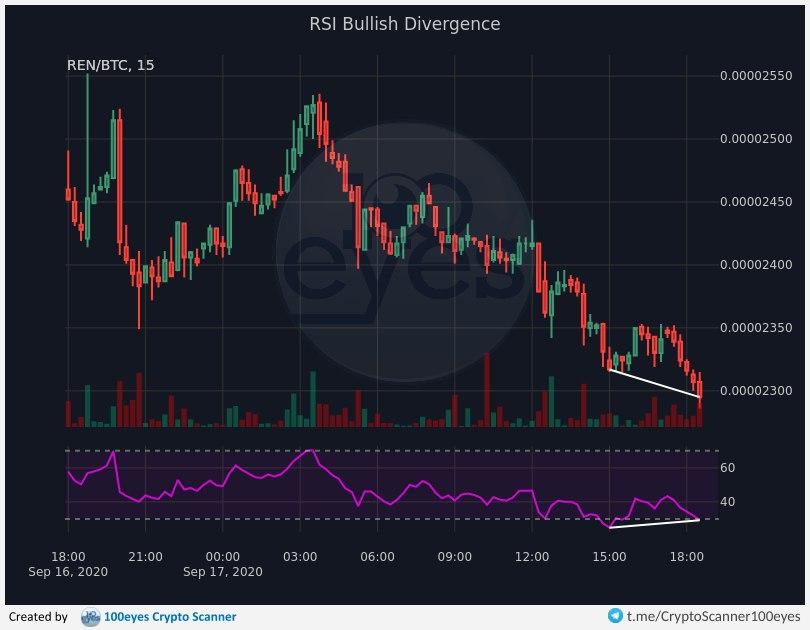
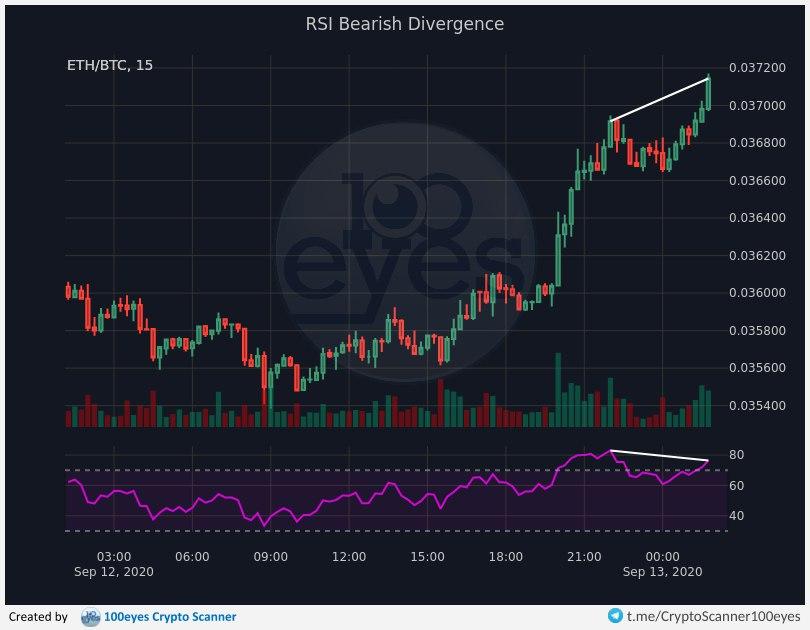
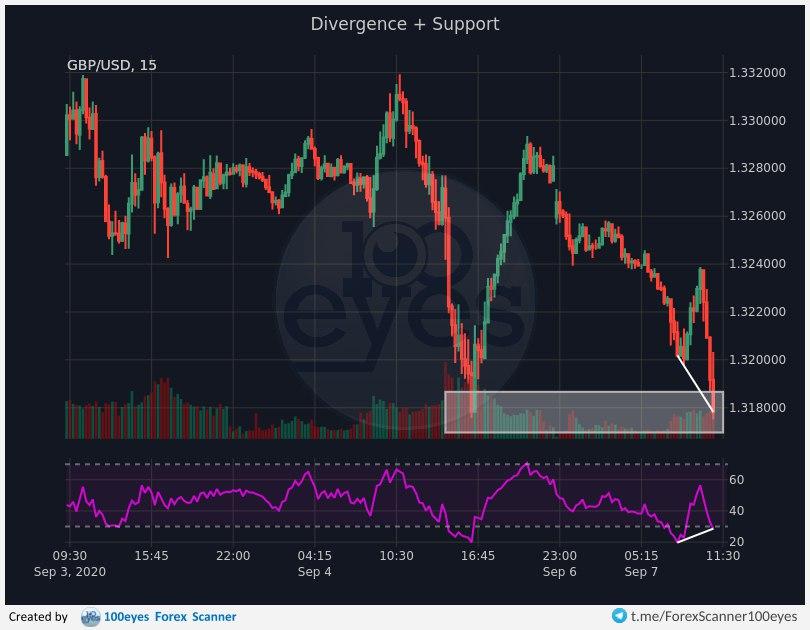
There are three main divergence alerts available based on the divergence between the price and RSI, in both the 100eyes Forex Scanner and the 100eyes Crypto Scanner. We have the RSI Bullish Divergence, RSI Bearish Divergence, and Hidden RSI Bullish Divergence alerts. Besides plain divergence alerts there are two more confluence alerts that trigger on the combination of the Near Horizontal Support and RSI Bullish Divergence, or the Near Horizontal Resistance and RSI Bearish Divergence alerts.
All five alerts are available on the 15m, 1h, 2h, and 4h time frames and can be enabled or disabled in the online portal. They are available for both the premium members and the trial members, and realtime examples can also be found on our preview channels and on Twitter.
About 100eyes
Stop spending hours of your time searching for good entries. Make your crypto or forex trading easier by using the 100eyes scanner.


Tags
market updates crypto binance discount referral confluence RSI Divergence Divergence MACD divergence support and resistance horizontal support horizontal resistance risk management risk risk reward okex trading fees market_updates