Support and Resistance
3 mins read

Support and Resistance
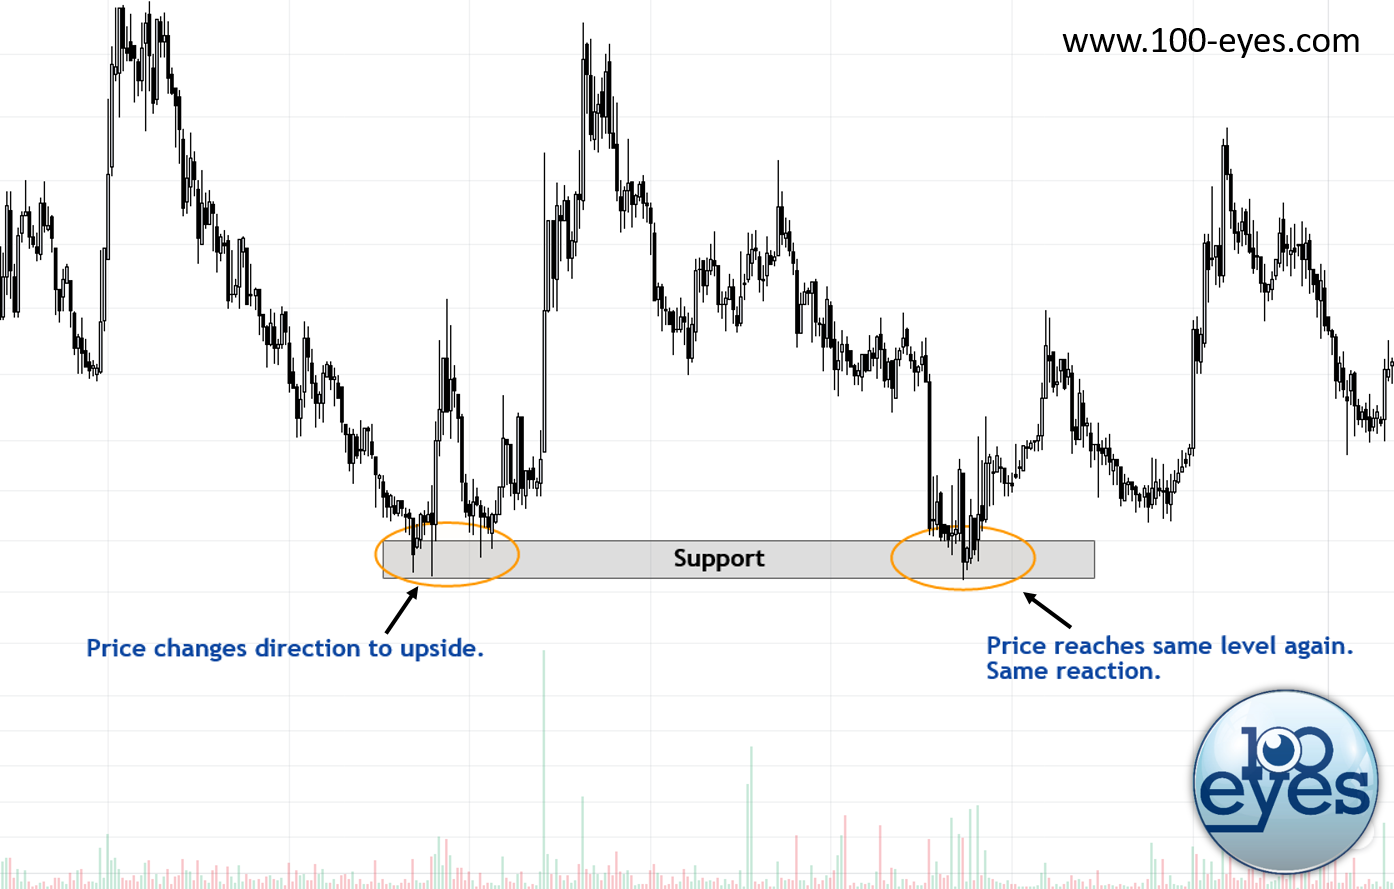
Support and Resistance refer to points, levels, or zones where price has reversed or changed direction in the past. Traders react to these levels and assume price will respond in a similar manner if price reaches the same level again. As a result, it often does. In other words, if the price previously reversed at a certain level, there’s an above average chance it will happen again.
Support and resistance levels are widely used as entry and exit points in profitable trading strategies. Buying at support and selling at resistance with a decent Risk Reward Ratio is a common support and resistance trading strategy.
Besides horizontal levels, support and resistance can have many forms and applications. Examples of other factors that are often used to identify support and resistance are trend lines, moving averages, and Fibonacci levels.
Horizontal Support
If the price declines and then changes direction to the upside, the lowest point is referred to as support. Apparently the price declined to a level which was low enough to draw interest from buyers, and therefore the price changed direction. If after some time the price reaches the same support level, there is an above average chance that buyers will step in again. Therefore, horizontal support levels provide buy opportunities.
Horizontal Resistance
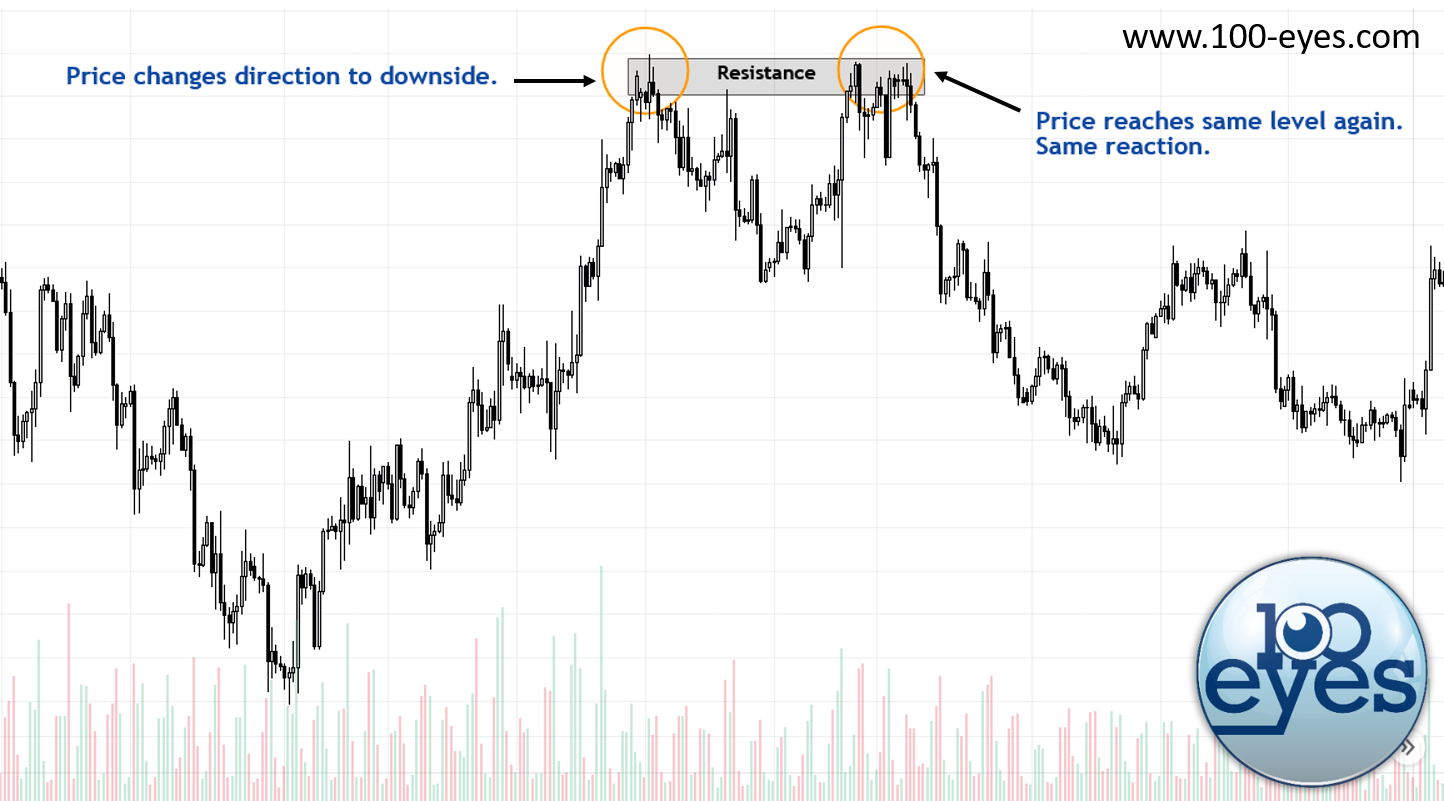
If the price rises and then changes direction to the downside, the highest point is referred to as resistance. Apparently the price reached a level which was high enough to encourage profit-taking or short selling, and therefore the price has dropped. If after some time the price reaches the same resistance level again, there is an above average chance that the level will be used for selling again and the price will not rise above it. Therefore, horizontal resistance levels provide sell opportunities.
Level strength after multiple tests
Sometimes the price seems to be unable to break a certain level, this can be either to the upside or downside. When the same level rejects the price again and again, it is important to understand that the level becomes weaker with every test.
The support or resistance “takes a hit” every time it is being attacked, and will lose a portion of its power. Eventually the level has an above average chance of breaking as a result of the repeated pressure. Traders commonly use this principle to buy the breakout or retest of the particular level.
SR flip principle
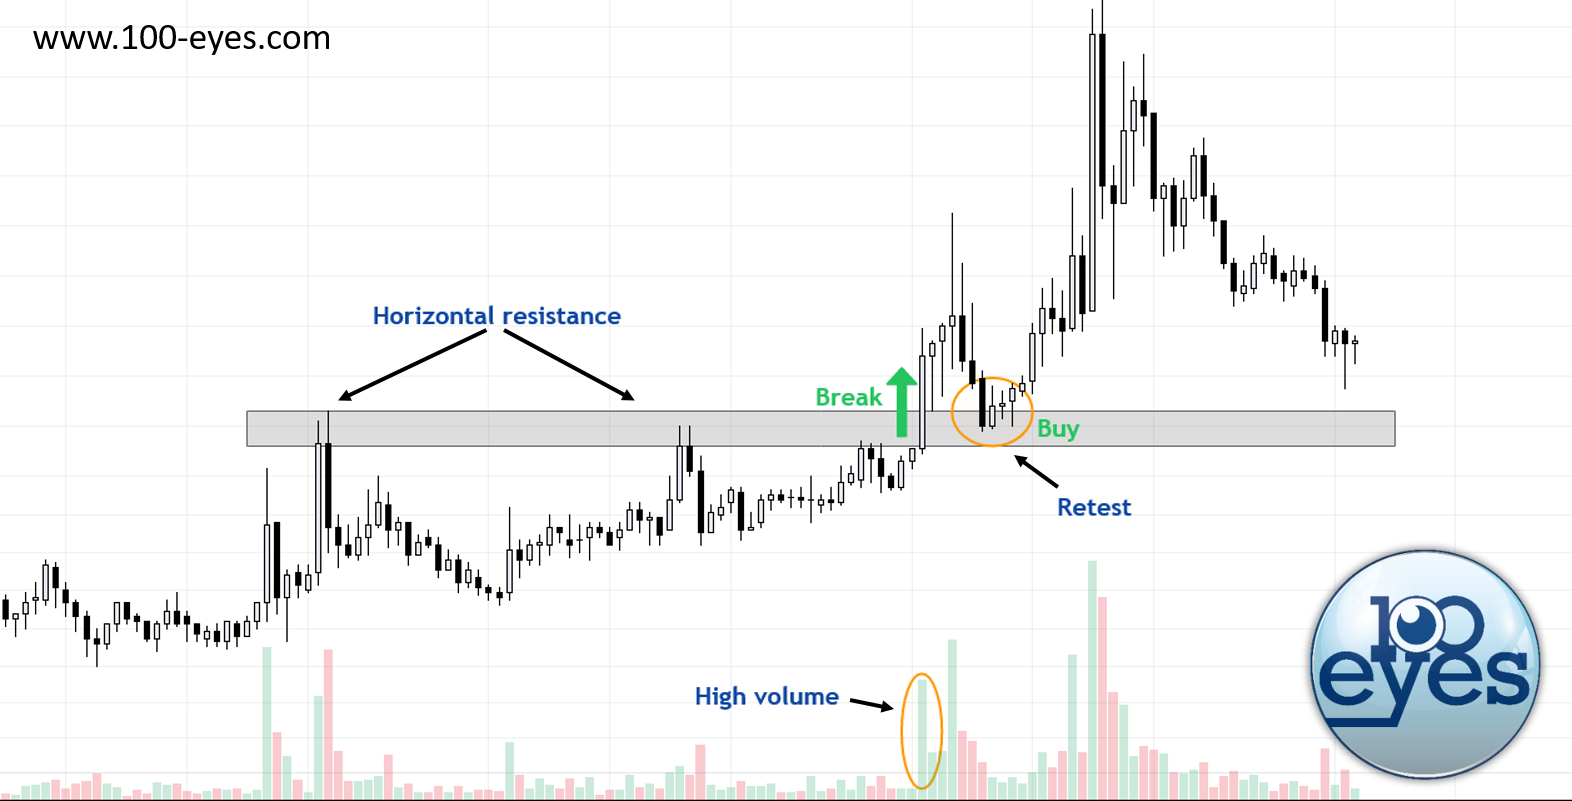
Besides buying at support and selling at resistance, the ”Support/Resistance Flip” principle provides reliable entry opportunities. Although supports and resistances are likely to hold, they do not always hold. After a support or resistance is broken, the level remains useful. This is due to the general trading rule that a broken support becomes resistance, and a broken resistance becomes support. In other words, once a broken resistance level gets retested, it tends to act as support. This concept is particularly reliable when a support or resistance level breaks on high volume. The chart below shows an example of a typical SR flip where the retest of the old resistance level provided a buying opportunity.
Support and Resistance Alerts
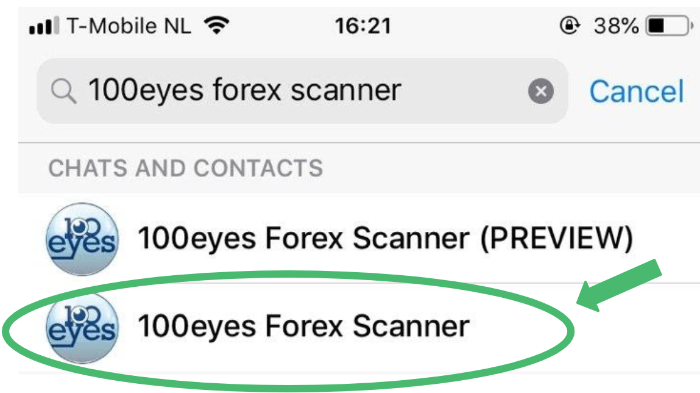
Automated alerts for horizontal support and resistance zones are available in the 100eyes scanner. If you are looking for a support and resistance indicator for crypto you can use the 100eyes Crypto Scanner, and if you were looking for a support and resistance scanner for forex or commodities (such as Gold and Silver) you can use the 100eyes Forex Scanner.
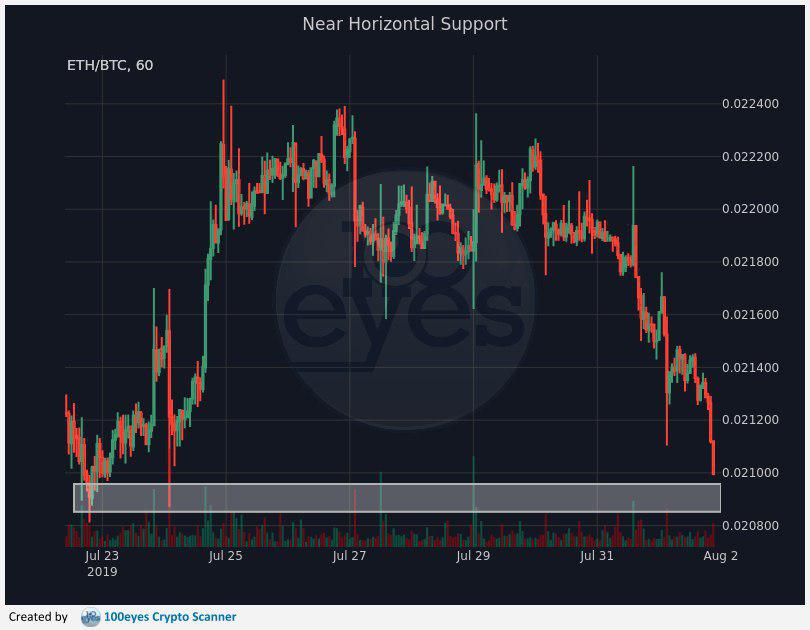
The 100eyes scanner provides automated alerts for support and resistance areas that include an image that describes where the support and resistance lines can be found. Through a grey box on the image, the zone is highlighted. The alert is already triggered when the price is getting close to the support or resistance zone, even when it has not hit the area yet. The decision to alert relatively early was made to allow for some time to log-in your broker account and set up a trade accordingly.
This alert is especially useful since Tradingview does not provide a reliable support and resistance indicator, so without 100eyes it can be difficult to spot them quickly or get alerted when a new support or resistance zone is found.
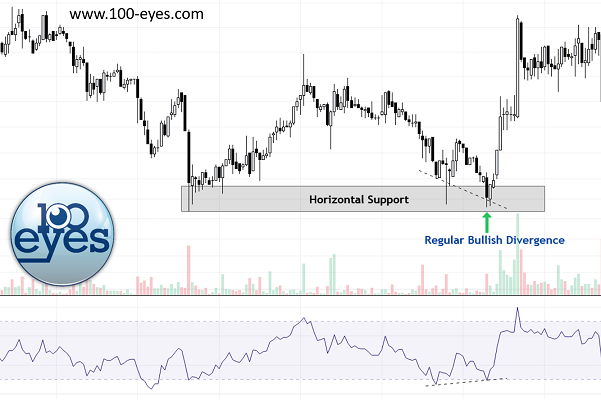
There are four different alerts available, in both the 100eyes Forex Scanner and the 100eyes Crypto Scanner. We have the 'Near Horizontal Support', 'Near Horizontal Resistance', 'Divergence + Support', and 'Divergence + Resistance' alerts. The latter two are confluence alerts that trigger on the combination of the Near Horizontal Support and RSI Bullish Divergence, or the Near Horizontal Resistance and RSI Bearish Divergence alerts.
All four alerts are available on the 15m, 1h, 2h, and 4h time frames and can be enabled or disabled in the online portal. They are available for both the premium members and the trial members, and realtime examples can also be found on our preview channels and on Twitter.
About 100eyes
Stop spending hours of your time searching for good entries. Make your crypto or forex trading easier by using the 100eyes scanner.
Tags
market updates crypto binance discount referral confluence RSI Divergence Divergence MACD divergence support and resistance horizontal support horizontal resistance risk management risk risk reward okex trading fees market_updates